4 Intro to ggplot2
4.1 Data visualization in R with ggplot2
One of the main (best) packages for data visualization in R is the ggplot2 package. This package is also part of the tidyverse suite of packages, and is commonly referred to as “ggplot”. You can read more about the background to ggplot2 here.
ggplot code is fairly templatic, and works by creating “layers” to a plot. You will always need the following three components in your ggplot code:
- the ggplot() function that tells R you want to create a graph with some data frame
- the geom_X() function where X refers to the specific type of plot you want to make (histogram, scatterplot, etc.). We’ll go over some possible geom_X functions below
- an aesthetics mapping aes() that tells R how to arrange the variables on the plot
4.1.1 Some examples of the ggplot() structure:
ggplot(mydata) +
  geom_histogram(aes(x = var1))

ggplot(mydata) +
  geom_boxplot(aes(x = var1, y = var2))

ggplot(mydata) +
  geom_point(aes(x = var1, y = var2))

ggplot(mydata) +
  geom_bar(aes(x = var1, y = the_count))
You can put the aesthetics mapping in either the geom_X() function or the ggplot() function. Sometimes it makes a difference; sometimes not: if you find yourself running into an issue, I would recommend putting the aes() mapping in the main ggplot() function.
A little more on this can be found here.
4.1.2 Getting set up
First, you’ll need to install the package and load it into your current library of packages.
## Loading required package: ggplot2## Loading required package: tidyverse## ── Attaching core tidyverse packages ──────────────────────── tidyverse 2.0.0 ──
## ✔ dplyr 1.1.2 ✔ readr 2.1.4
## ✔ forcats 1.0.0 ✔ stringr 1.5.0
## ✔ lubridate 1.9.2 ✔ tibble 3.2.1
## ✔ purrr 1.0.1 ✔ tidyr 1.3.0
## ── Conflicts ────────────────────────────────────────── tidyverse_conflicts() ──
## ✖ dplyr::filter() masks stats::filter()
## ✖ dplyr::lag() masks stats::lag()
## ℹ Use the conflicted package (<http://conflicted.r-lib.org/>) to force all conflicts to become errorsLet’s load in the dataset:
4.2 Histograms
When you want to plot the distribution of one continuous variable, use a histogram:
## `stat_bin()` using `bins = 30`. Pick better value with `binwidth`.## Warning: Removed 7 rows containing non-finite values (`stat_bin()`).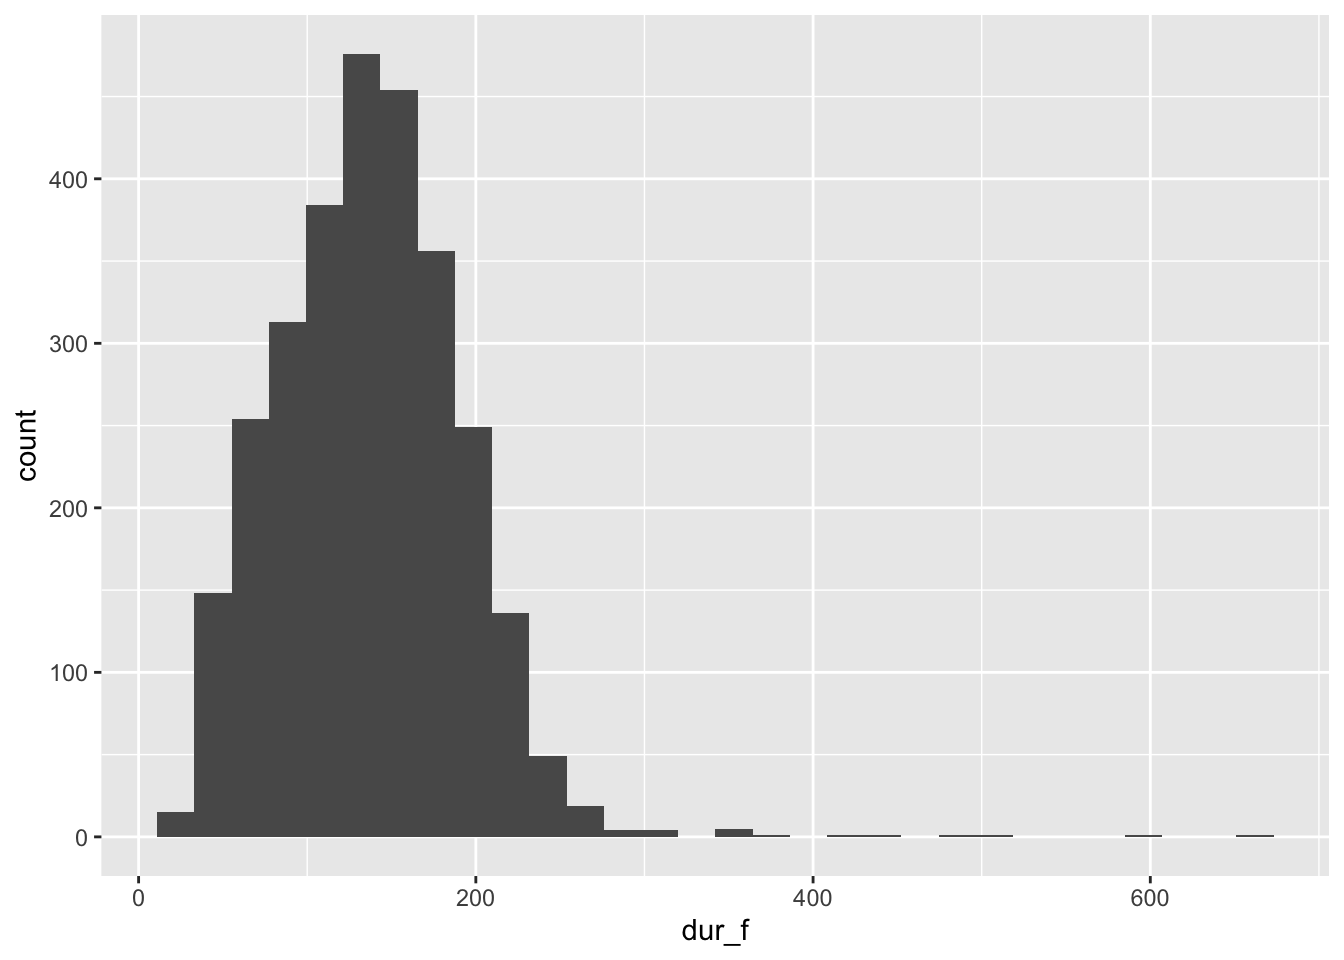
The binwidth warning simply tells you that it’s using a default binwidth for grouping the counts together. The other warning indicating it removed rows refers to the fact that 7 of the values in the dur_f column are actually “NA” values, so can’t be represented in the histogram. You’ll frequently see this warning below; it’s usually safe to ignore unless you know that none of the values are missing.
4.3 Boxplots
When you want to plot the distribution of one continuous variable, but for separate categories, a boxplot is great. I would say I use this type of visualization most frequently in my own personal research:
## Warning: Removed 7 rows containing non-finite values (`stat_boxplot()`).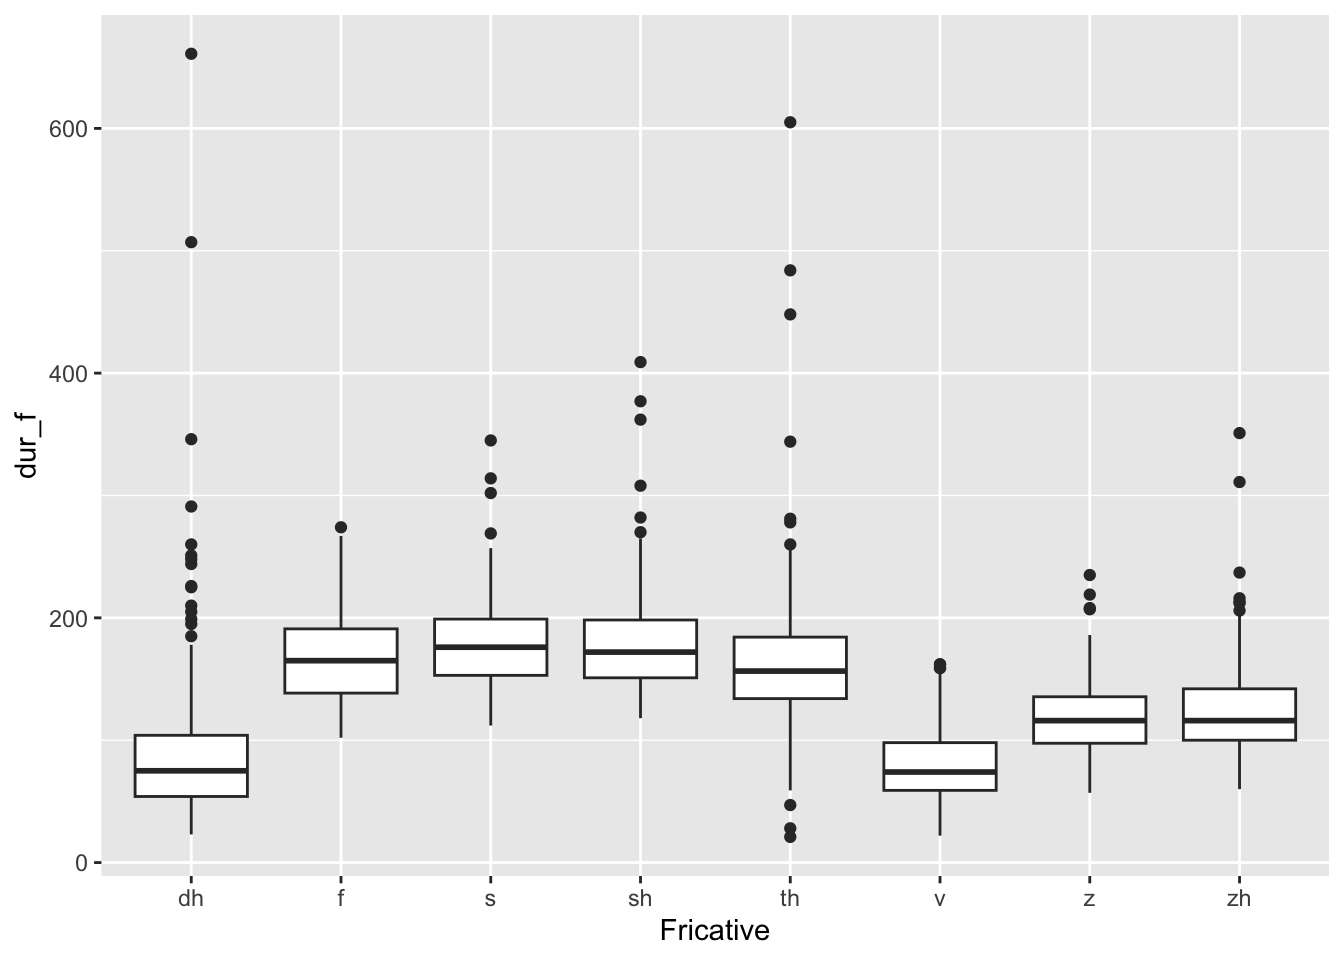
4.4 Scatterplots
When you have two continuous variables and you want to show the relationship between them, you’ll want a scatterplot. Think carefully about which variable you’ll want on the x-axis, and which one on the y-axis:
## Warning: Removed 10 rows containing missing values (`geom_point()`).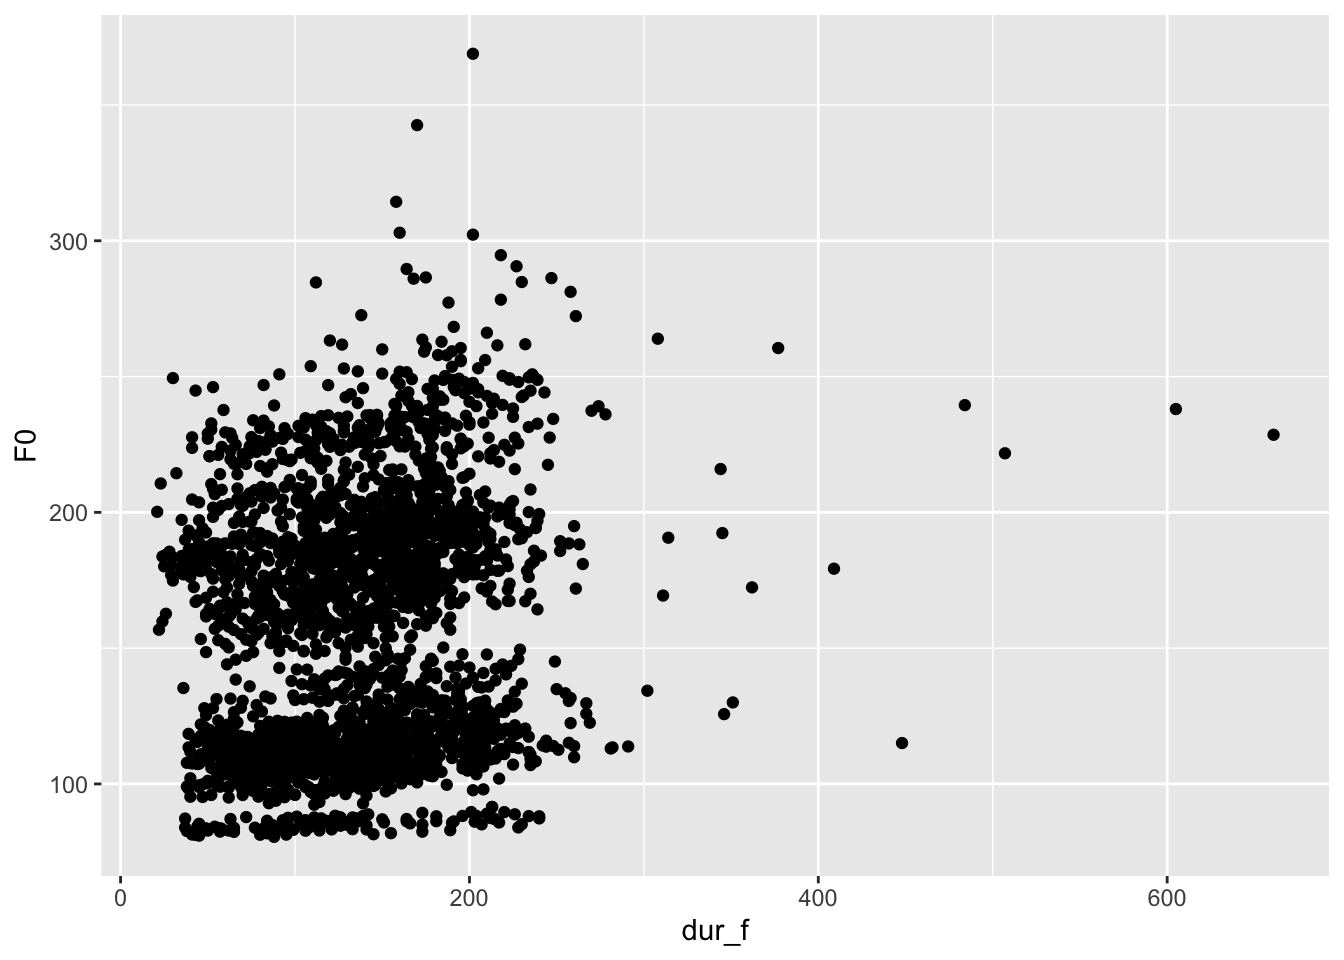
4.5 Bar graphs
When you want to display the count or proportion of different levels of a categorical variable, you’ll want a bar graph:
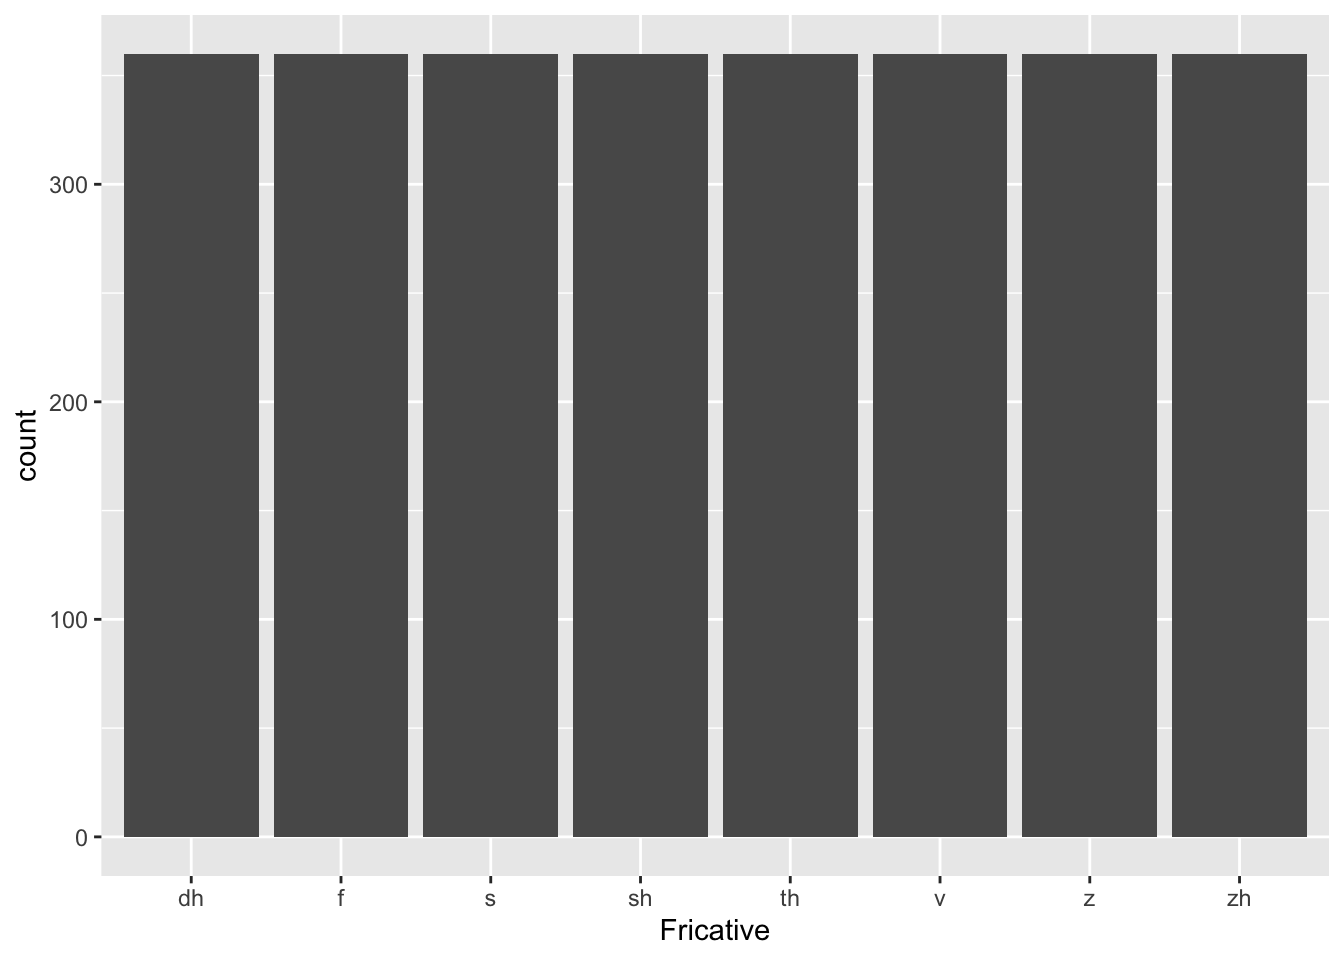
That bar graph is a little boring and uninformative, though, as we have an equal number of occurrences for each fricative! Let’s make a new categorical variable in our dataset that simply categorizes someone’s F0 into a “high F0” category and a “low F0” category. If the F0 is greater than 200, let’s call it “high”, otherwise it’s low. Note the use of the ifelse() function in this case:
## highf0
## high  low
##  522 2349
Now let’s create a bar graph that shows us the number of tokens in each F0 bin. We’ll use x = highf0 which will list each level of the highf0 column (“high”, “low”) along the x-axis.

Some of the f0 values are “NA”, which is now showing up in our plot. To drop these values, we need to take a subset of the dataset which drops the NA values. Remember that the exclamation point ! means “not”

4.6 Layering
4.6.1 Facetting
Let’s say we want a separate scatterplot looking at the relationship between the duration of the fricative (dur_f) and the duration of the vowel (dur_v) for each fricative separately. We can use facet_wrap(~Fricative) to split this up:
## Warning: Removed 7 rows containing missing values (`geom_point()`).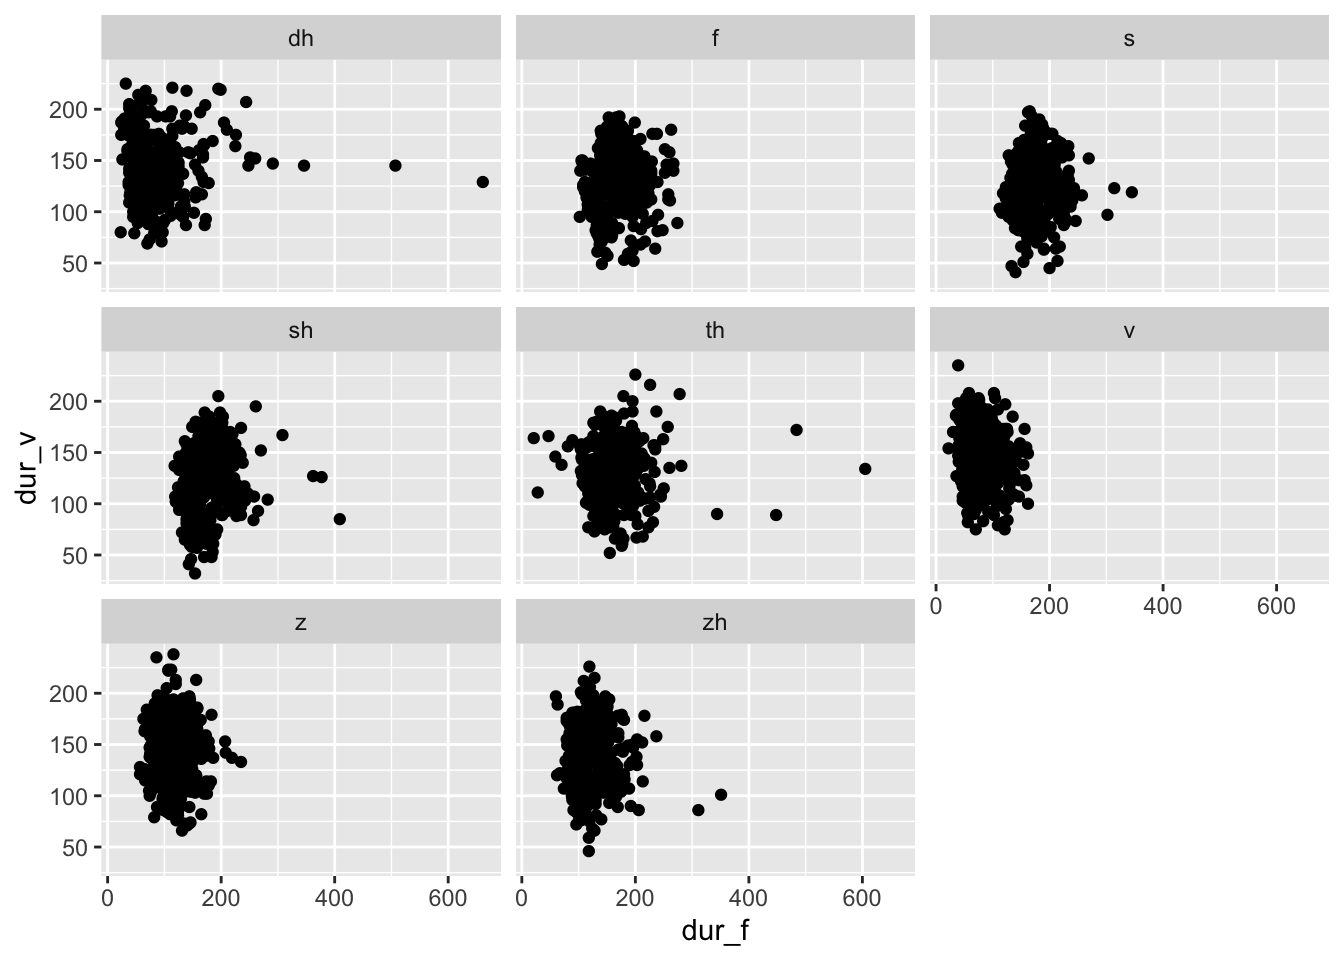
You can combine facet_wrap() with any plot. Here’s an example with a histogram:
## `stat_bin()` using `bins = 30`. Pick better value with `binwidth`.## Warning: Removed 7 rows containing non-finite values (`stat_bin()`).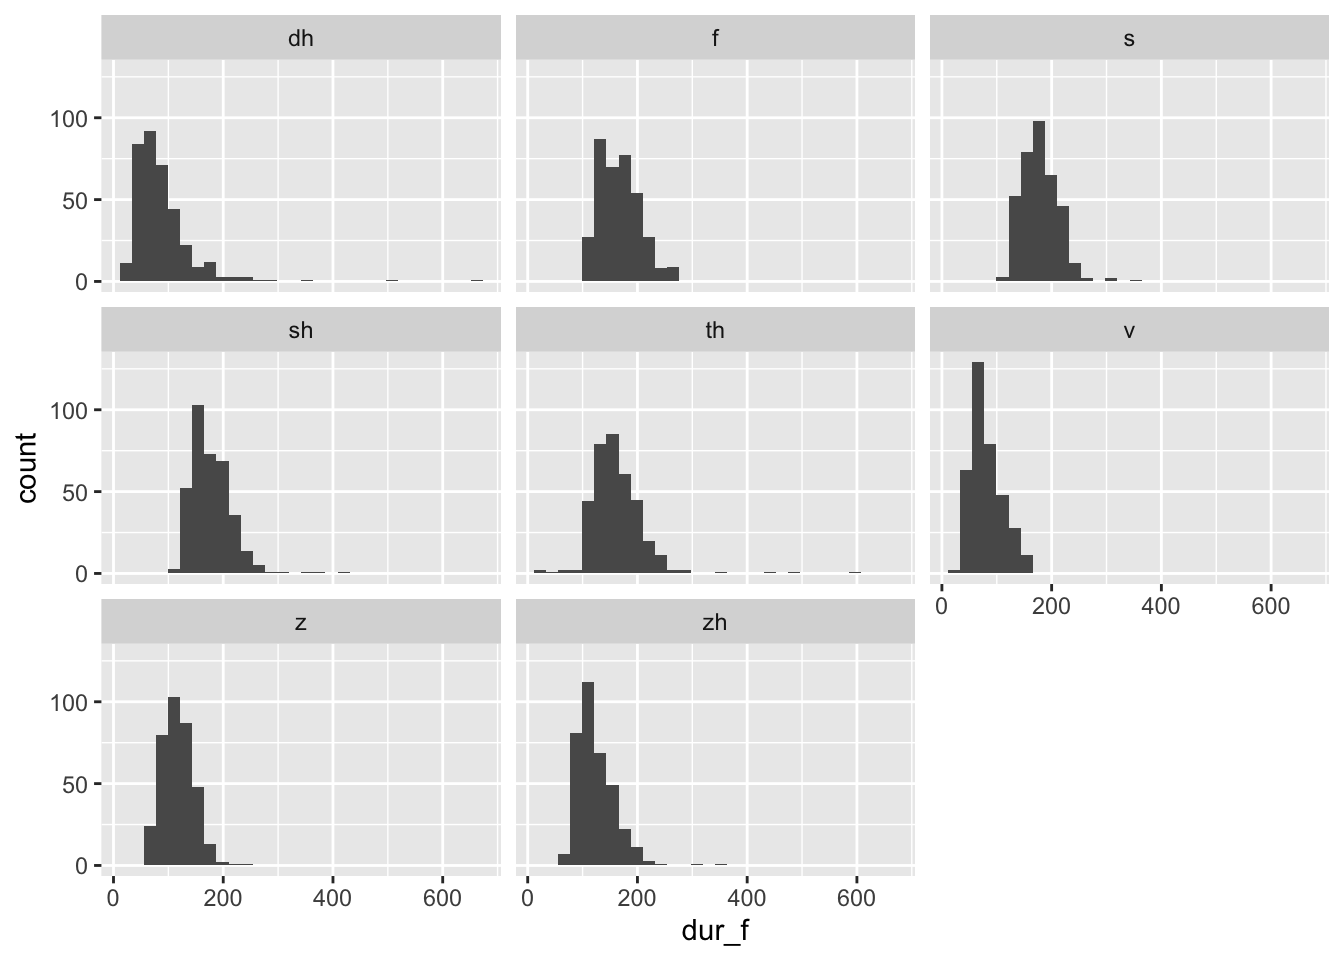
4.6.2 Axis labels
Sometimes you want a more informative label on your x- or y-axes than your column name might provide. You can use the xlab() and ylab() functions to add an axis label.
For example:
ggplot(mcm) + geom_boxplot(aes(x = Fricative, y = dur_f)) +
  xlab("fricative") +
  ylab("fricative duration (ms)")
## Warning: Removed 7 rows containing non-finite values (`stat_boxplot()`).
4.6.3 Axis limits
Sometimes you want to truncate the displayed data on the axes, or make sure it’s very consistent. You can specify an exact range by using the functions xlim(number1, number2) and ylim(number1, number2). Example below:
## Warning: Removed 10 rows containing missing values (`geom_point()`).
4.6.4 Colors
There are so many colors in R!
There are confusingly two ggplot arguments that will make use of color:
- the color argument
- the fill argument
The color argument actually just changes the outline color. The fill argument will refer to the color of a column in e.g., a bar graph or histogram.
We’ll first start with an example where we keep the outline color constant across every variable in the figure. When you want everything to be the same color, you put the color variable outside of the aes() function, but within the geom_X() function:
## `stat_bin()` using `bins = 30`. Pick better value with `binwidth`.## Warning: Removed 7 rows containing non-finite values (`stat_bin()`).
So you can see how the color doesn’t change, let’s add the facet_wrap() argument:
## `stat_bin()` using `bins = 30`. Pick better value with `binwidth`.## Warning: Removed 7 rows containing non-finite values (`stat_bin()`).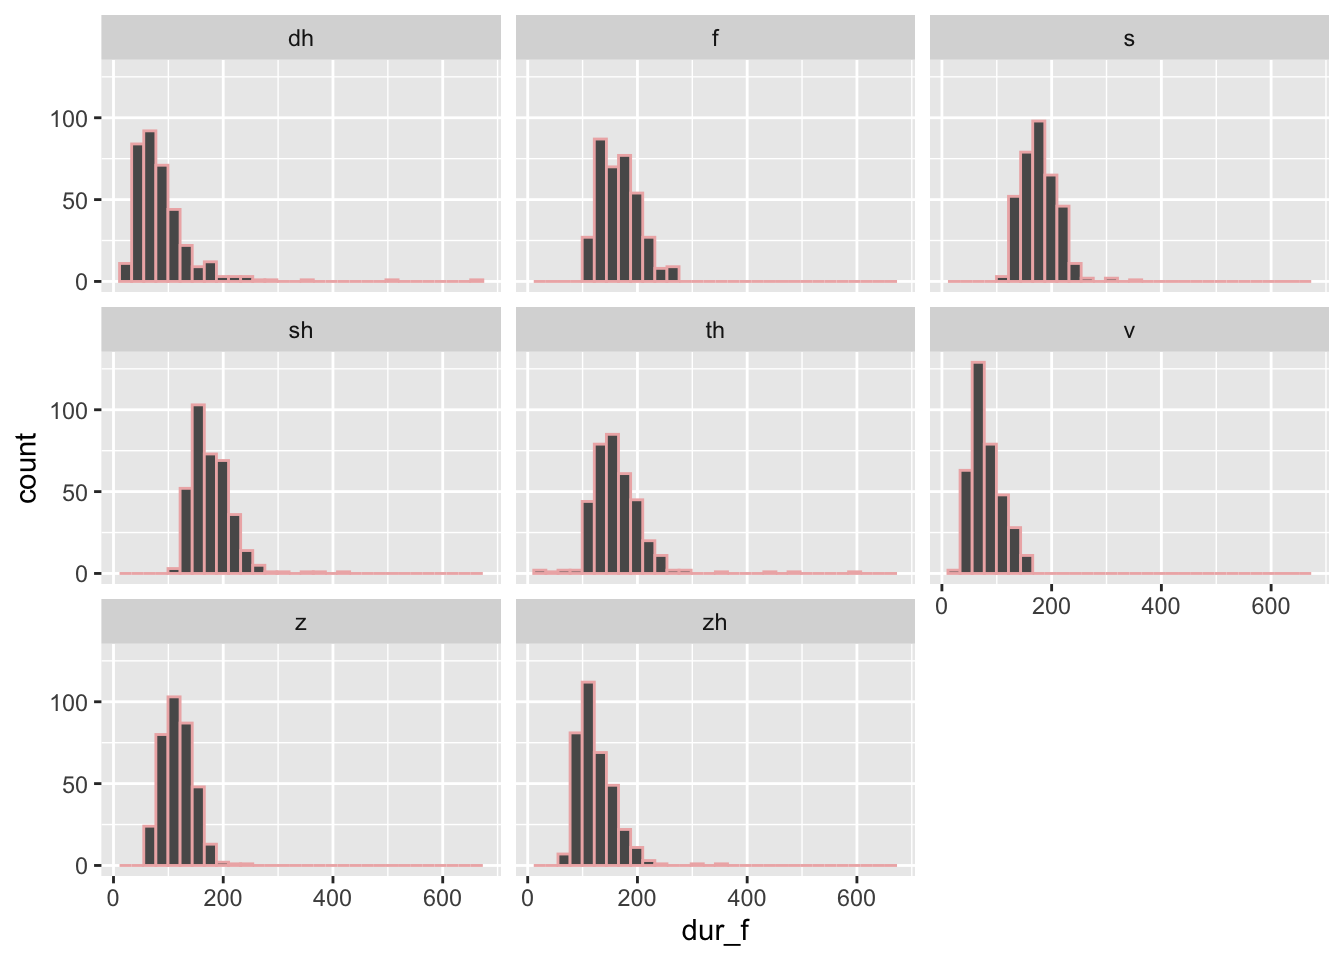
We can do the exact same thing with fill. Note the difference:
## `stat_bin()` using `bins = 30`. Pick better value with `binwidth`.## Warning: Removed 7 rows containing non-finite values (`stat_bin()`).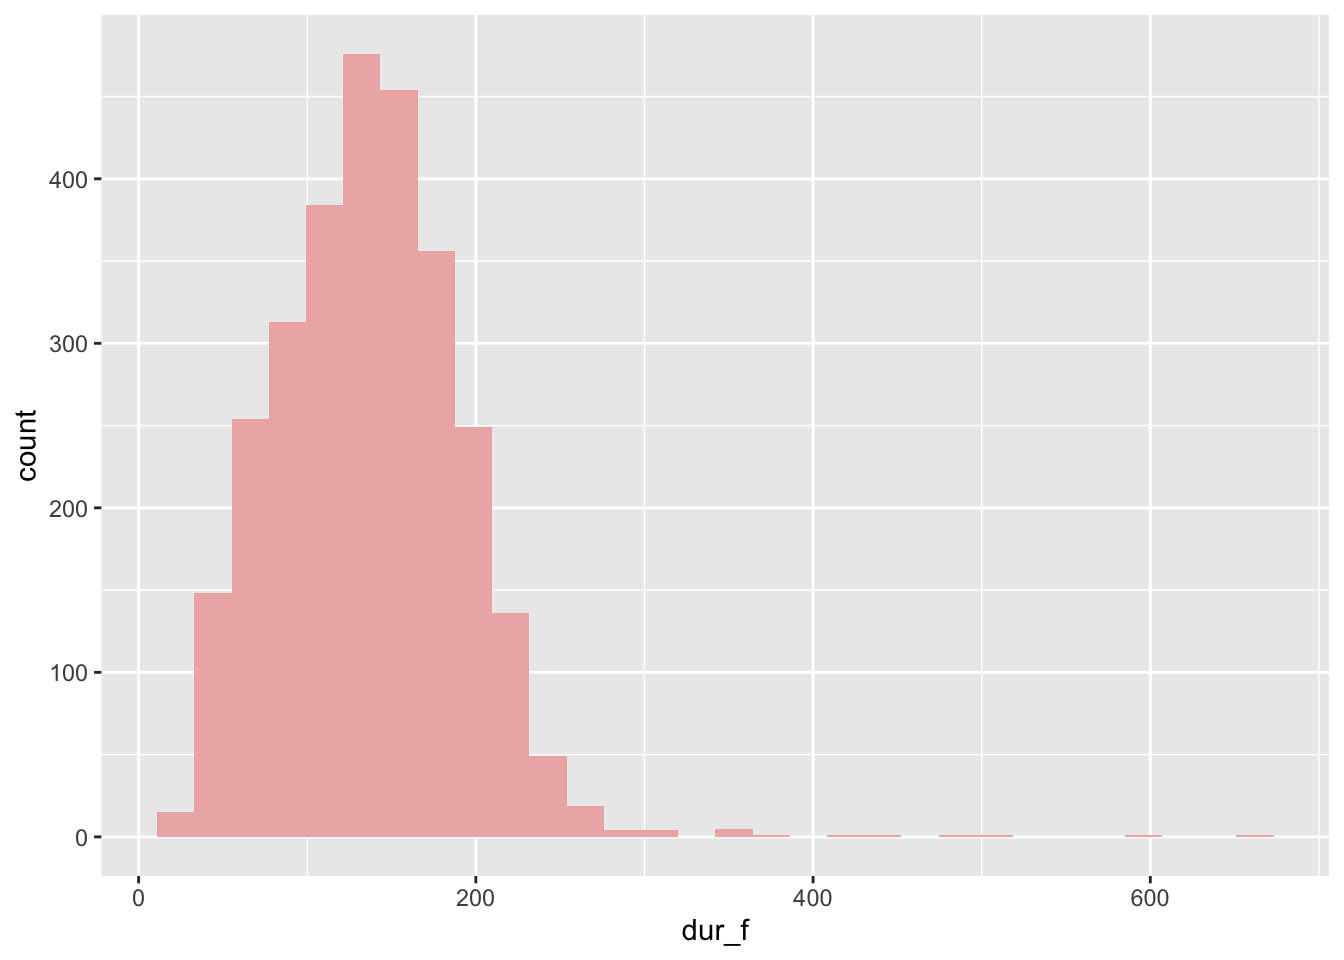
You can also combine the two; order doesn’t matter:
## `stat_bin()` using `bins = 30`. Pick better value with `binwidth`.## Warning: Removed 7 rows containing non-finite values (`stat_bin()`).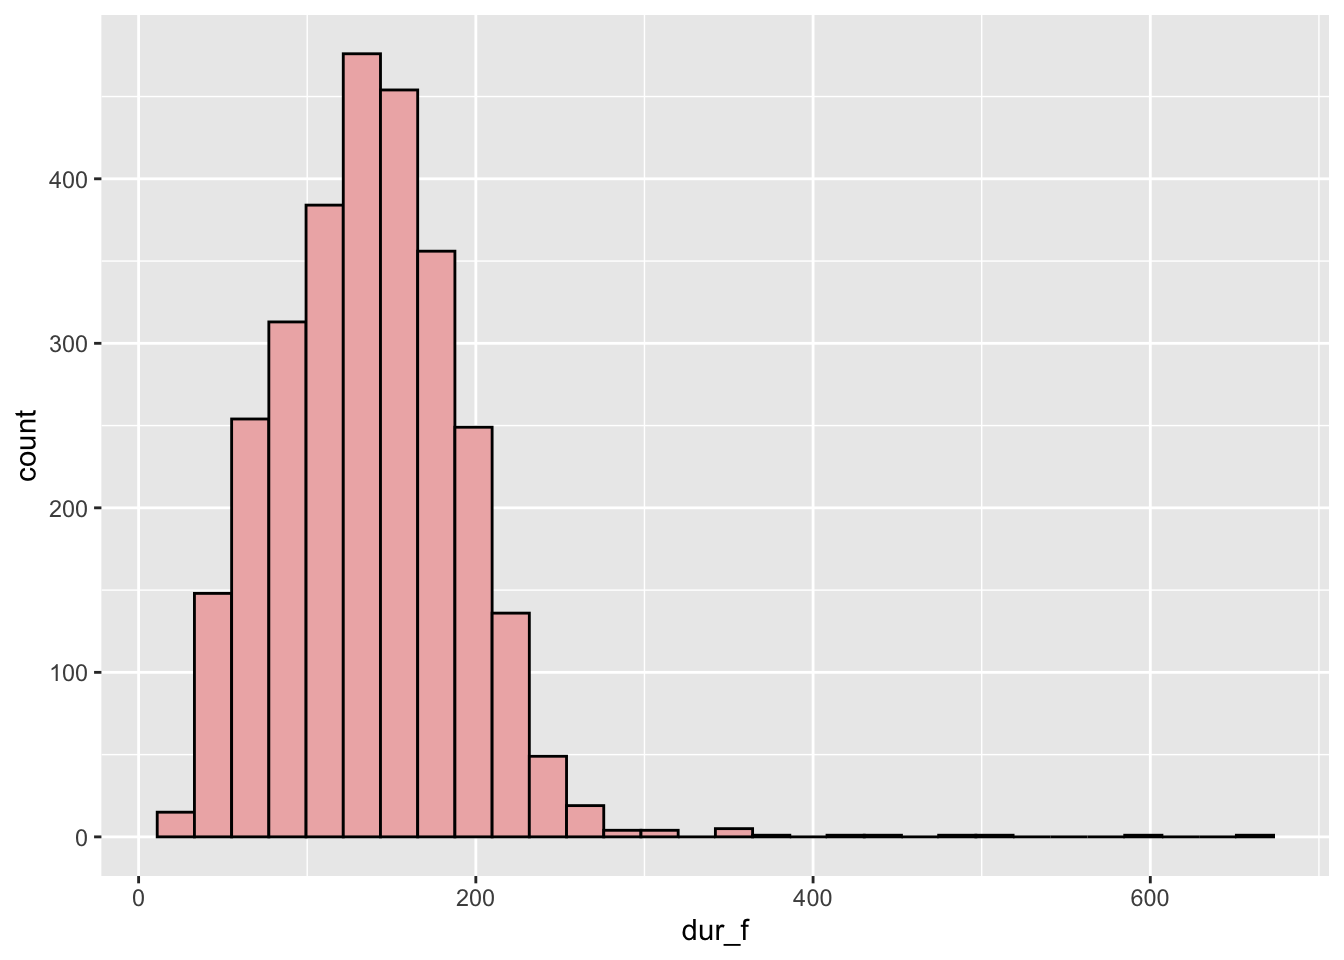
The second set of examples will be where the color changes with the level of a categorical variable. This can be a pretty powerful mapping in your figures. For example, we can have boxplots of the fricative duration for each fricative, that’s plotted on the x-axis, and use color to split the boxplots by gender (another categorical variable). To do this, we put color or fill inside the aes() mapping. When we do this, the color or fill is mapped to some variable. Note that we then lose the immediate ability to specify the color that R uses, but we’ll return to that in a moment. Also important to note is that there are several options that can go inside the aes() mapping besides color or fill including the size of a point, the shape of a point, the line type (dashed or solid), etc. I recommend looking this up online if it interests you.
First we also need to create the gender column – just go with me on this code:
mcm$gender <- substr(mcm$Talker, 1, 1)
ggplot(mcm) + geom_boxplot(aes(x = Fricative, y = dur_f, fill = gender))
## Warning: Removed 7 rows containing non-finite values (`stat_boxplot()`).
Further examples:
## Warning: Removed 7 rows containing non-finite values (`stat_boxplot()`).
## Warning: Removed 7 rows containing non-finite values (`stat_boxplot()`).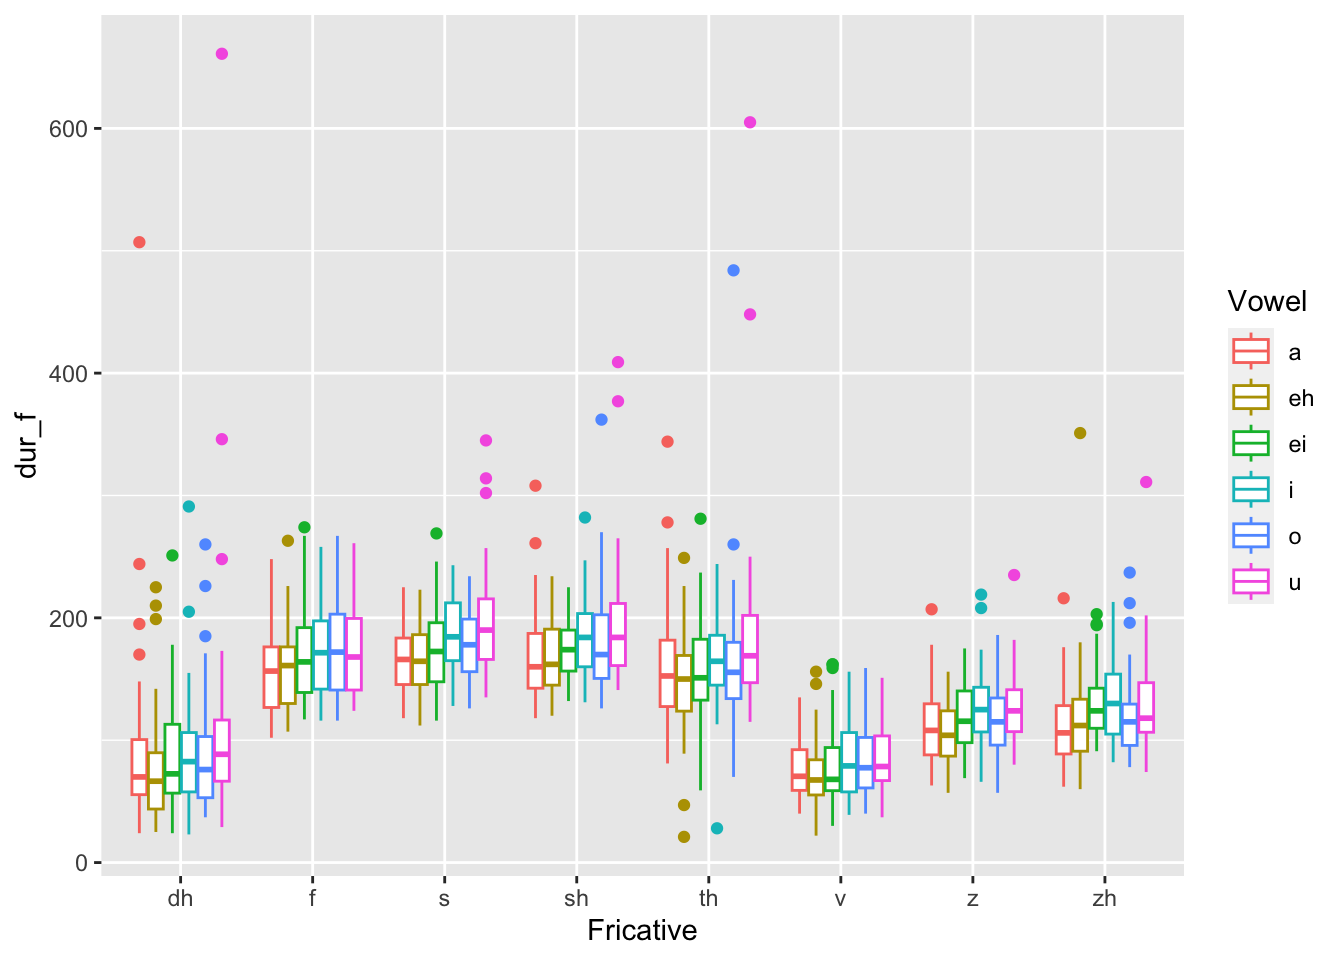
4.6.5 Change the color of the mapping
You can see how R used some default colors to map gender to the boxplot. You can also overwrite this using the scale_fill_manual() function. Let’s take look at how this works:
ggplot(mcm) + geom_boxplot(aes(x = Fricative, y = dur_f, fill = gender)) +
  scale_fill_manual(values = c("rosybrown2", "lightblue"))
## Warning: Removed 7 rows containing non-finite values (`stat_boxplot()`).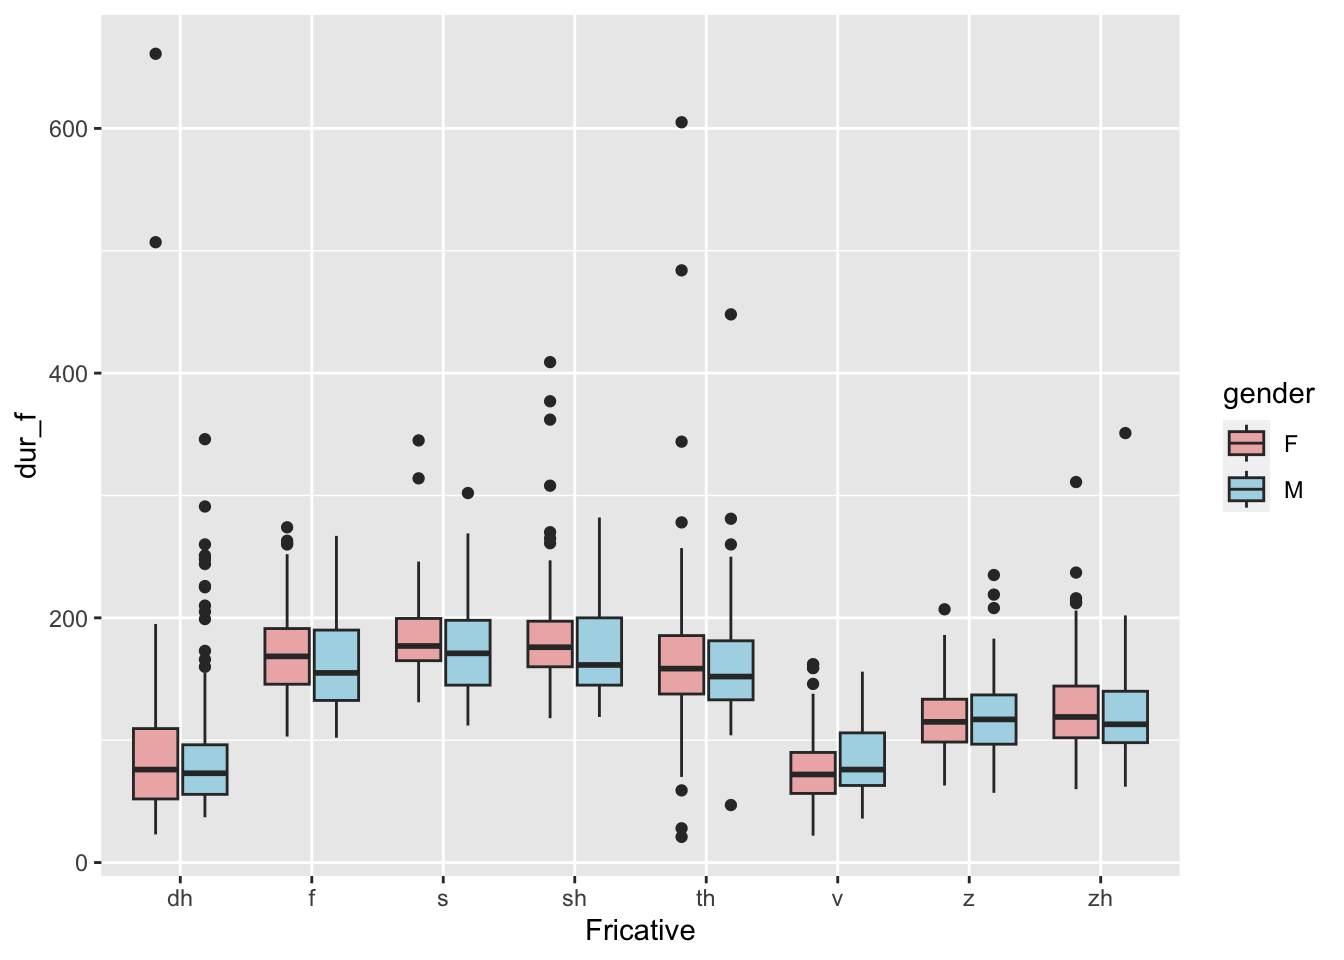
There are also some automatic color scales in R, and ones that work for colorblindness, etc. Some more info can be found by googling “color palettes” in R, and some good examples are on this page.
4.6.6 Background theme
You can change the “theme” of the R plot, which generally includes the background color, the presence of grid lines, the font size, and a few other things using some theme_X() functions. The default theme with the gray background is theme_gray(); many people like the theme_bw() background which uses a white background. There are several more theme_X() options in the ggthemes package.
Let’s first take a look at the theme_bw() function. You can put the font size in the parentheses if you want. (Note also the specification of the binwidth in this histogram):
ggplot(mcm) +
  geom_histogram(aes(x = dur_f), fill = "rosybrown2", color = "black", binwidth = 10) +
  xlab("fricative duration (ms)") +
  theme_bw(20)
## Warning: Removed 7 rows containing non-finite values (`stat_bin()`).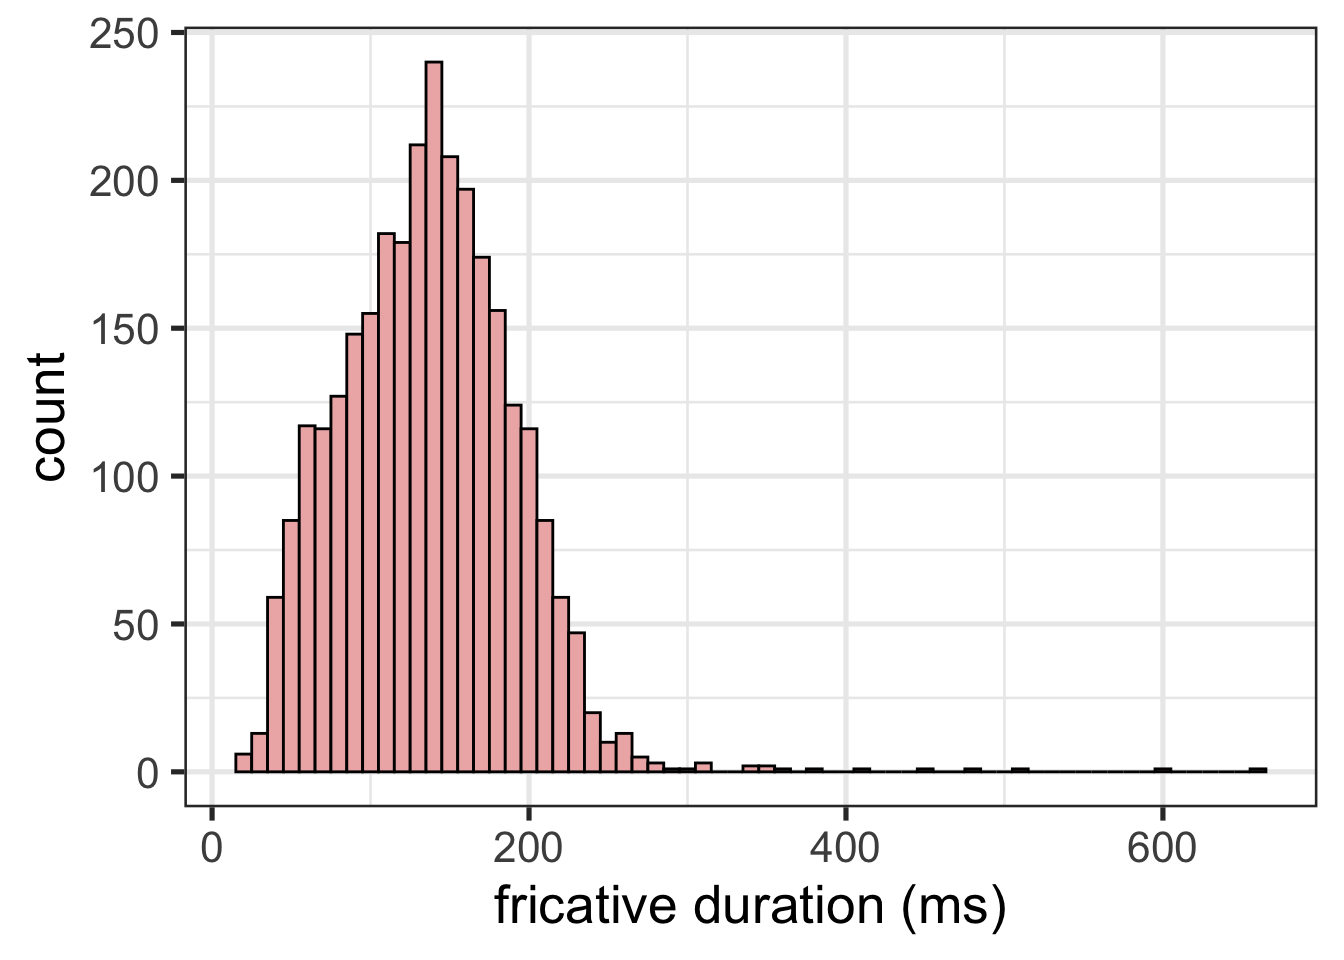
We can also install the ggthemes package to gain access to a few more themes:
## Loading required package: ggthemesLet’s use The Economist theme on a scatterplot of the vowel F1 and F2 just for fun…
ggplot(mcm) + geom_point(aes(x = F2, y = F1, color = Vowel)) +
  theme_economist(18) +
  xlab("F2 (Hz)") +
  ylab("F1 (Hz)")
## Warning: Removed 8 rows containing missing values (`geom_point()`).
4.6.7 Reversing continuous axes
You can also reverse an axis, which can be very useful for creating things like vowel plots! Let’s take the example above of the F1 x F2 space for vowels, and make it look like a standard vowel plot by reversing the direction of the two axes. You can do this with the functions scale_x_reverse() and scale_y_reverse(). You can then move the position of the axis by specifying its position as “top”, “bottom”, “left”, or “right”. Let’s use a different theme from the ggthemes package too – one of my favorites is theme_few():
ggplot(mcm) + geom_point(aes(x = F2, y = F1, color = Vowel)) +
  theme_few(18) +
  xlab("F2 (Hz)") +
  ylab("F1 (Hz)") +
  scale_x_reverse(position = "top") +
  scale_y_reverse(position = "right")
## Warning: Removed 8 rows containing missing values (`geom_point()`).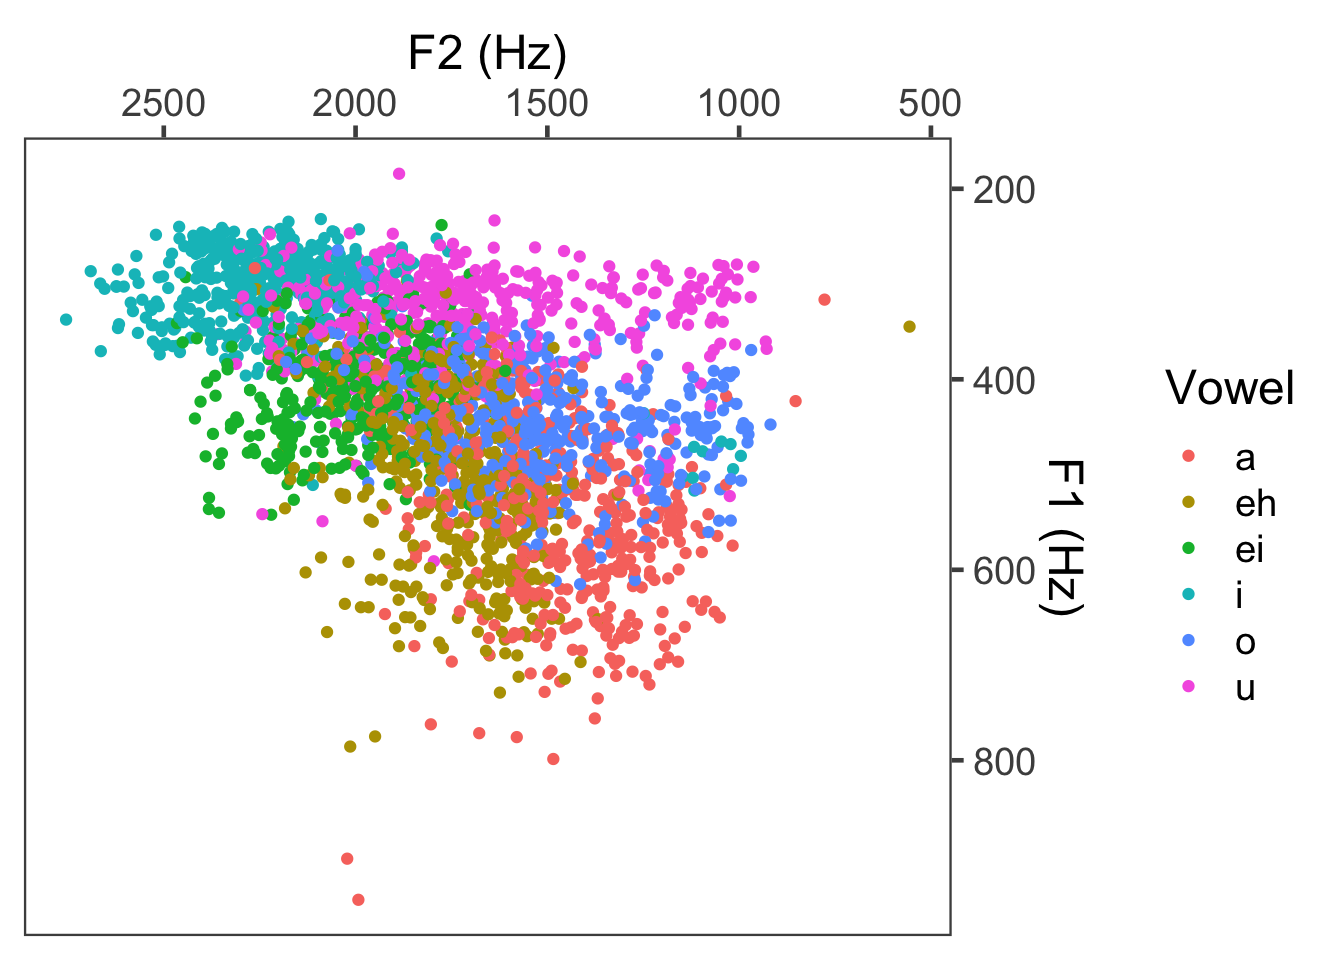
4.6.8 Reordering levels of a variable
By default, R orders the levels of a categorical variable alphabetically. In the above example with Vowel, you can see that it first listed “a”, then “eh”, then “ei”, then “i”, then “o”, then “u”. Sometimes this is fine, but sometimes you want to change the order that’s presented. For example, you might want the order of the Vowels to be a little more phonetically ordered, so something like
- i
- ei
- eh
- a
- o
- u
which creates somewhat of a circle around the F1xF2 vowel space (or articulatory goes from high front, down the front vowels, and up the back vowels). To do this, you have to use the factor() function on the column you want to reorder.
Now try replotting:
ggplot(mcm) + geom_point(aes(x = F2, y = F1, color = Vowel)) +
  theme_few(18) +
  xlab("F2 (Hz)") +
  ylab("F1 (Hz)") +
  scale_x_reverse(position = "top") +
  scale_y_reverse(position = "right")
## Warning: Removed 8 rows containing missing values (`geom_point()`).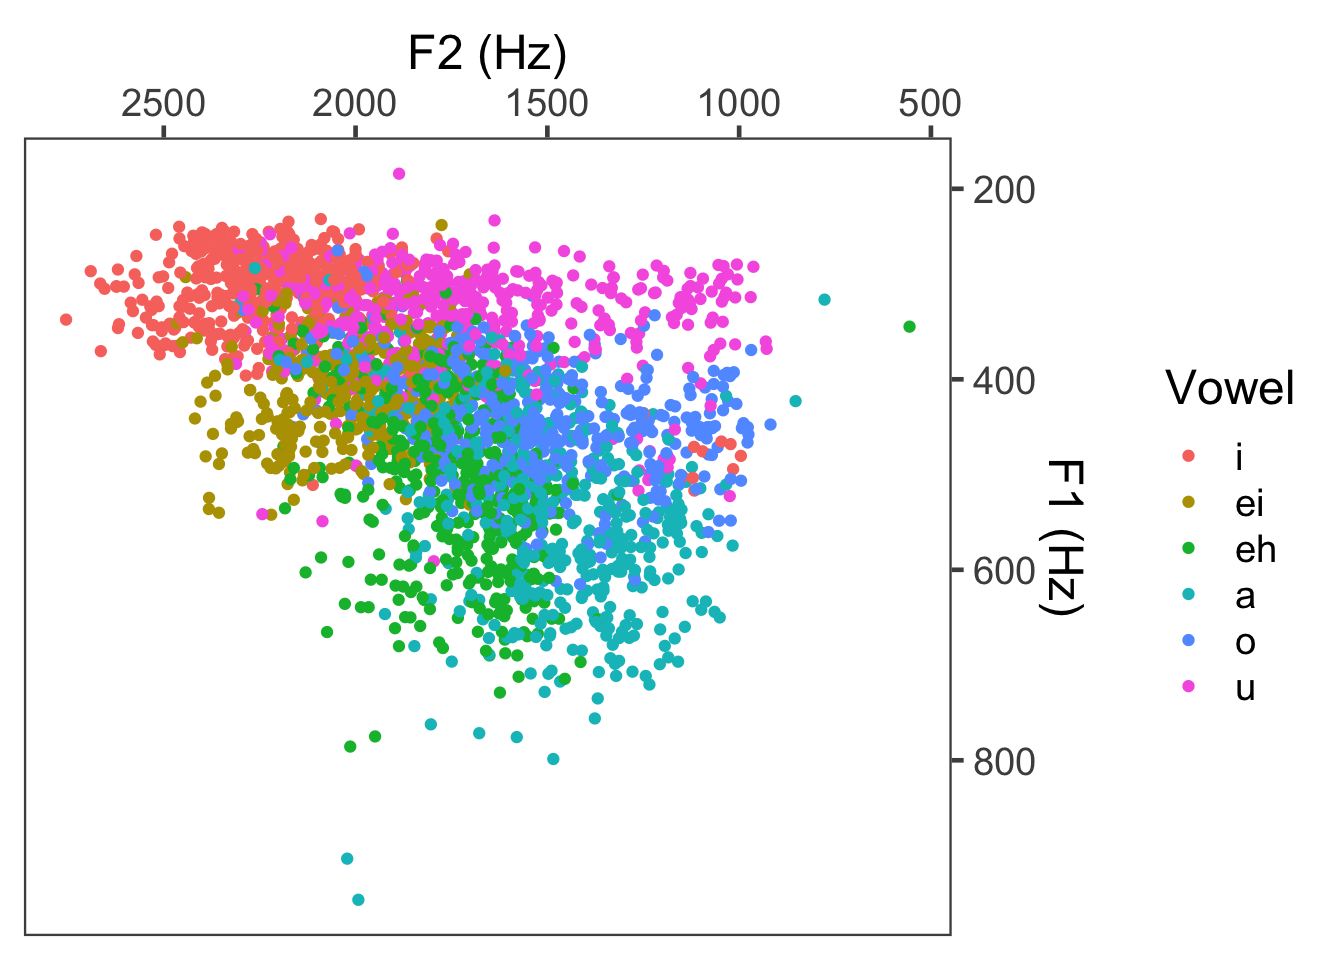
4.6.9 Enhancing the vowel plot
Let’s say we want to create a vowel plot of the mean F1 and F2 pairs instead of each individual point. Maybe we also want an ellipse around each vowel indicating the standard deviation. First step: getting the means. When deriving means and SDs, I first get the mean for each speaker, and then average over speaker means. The reasoning for this is that the data points coming from each speaker are non-independent from one another (they might frequently form little clusters around each speaker mean). Then I’ll take the mean of the speaker means (independent people) and the SD over that sample of speakers from the population.
spkr_means <- mcm %>%
  group_by(Talker, Vowel) %>%
  summarise(meanF1_spkr = mean(F1, na.rm = T), meanF2_spkr = mean(F2, na.rm = T))
## `summarise()` has grouped output by 'Talker'. You can override using the
## `.groups` argument.vowel_means <- spkr_means %>%
group_by(Vowel) %>%
summarise(meanF1 = mean(meanF1_spkr),
sdF1 = sd(meanF1_spkr),
meanF2 = mean(meanF2_spkr),
sdF2 = sd(meanF2_spkr))Now we can make the plot.
vowel_means$Vowel <- factor(vowel_means$Vowel, levels = c("i", "ei", "eh", "a", "o", "u"))
ggplot(vowel_means, aes(x = meanF2, y = meanF1, color = Vowel)) +
  geom_point() +
  geom_label(aes(label = Vowel), size = 10) +
  theme_few(24) +
  scale_x_reverse(position = "top") +
  scale_y_reverse(position = "right") +
  xlab("mean F2 (Hz)") +
  ylab("mean F1 (Hz)") +
  guides(label = "none", color = "none")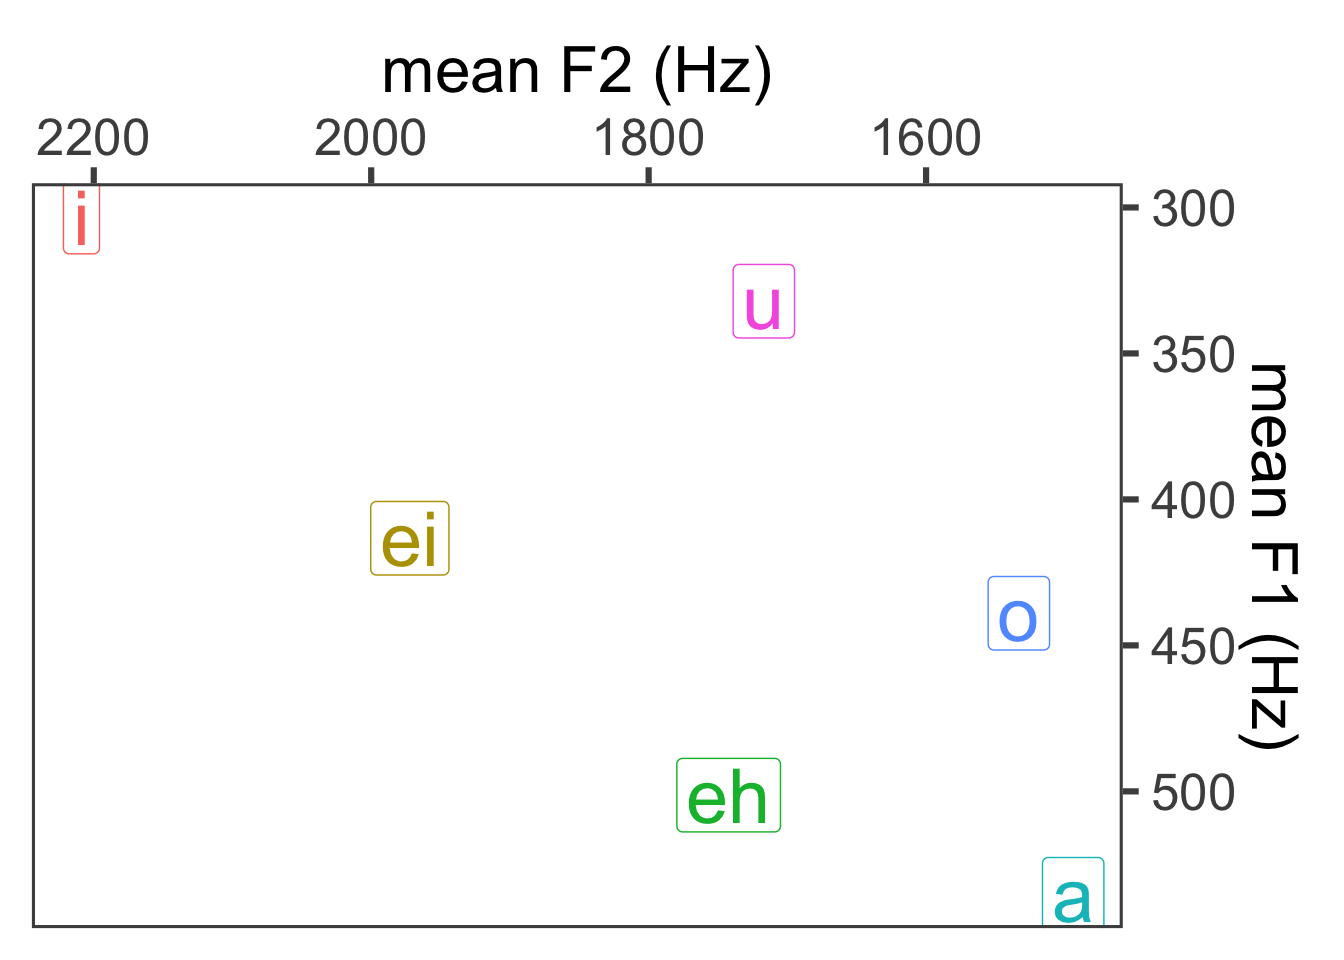
Add ellipses:
## Loading required package: ggforcevowel_means$Vowel <- factor(vowel_means$Vowel, levels = c("i", "ei", "eh", "a", "o", "u"))
ggplot(vowel_means, aes(x = meanF2, y = meanF1, color = Vowel)) +
geom_point() +
geom_label(aes(label = Vowel), size = 10) +
geom_ellipse(aes(x0 = meanF2, y0 = meanF1, a = sdF2, b = sdF1, angle = 0, color = Vowel, fill = Vowel), alpha = 0.07) +
theme_few(24) +
scale_x_reverse(position = "top") +
scale_y_reverse(position = "right") +
xlab("mean F2 (Hz)") +
ylab("mean F1 (Hz)") +
guides(label = "none", color = "none", fill = "none")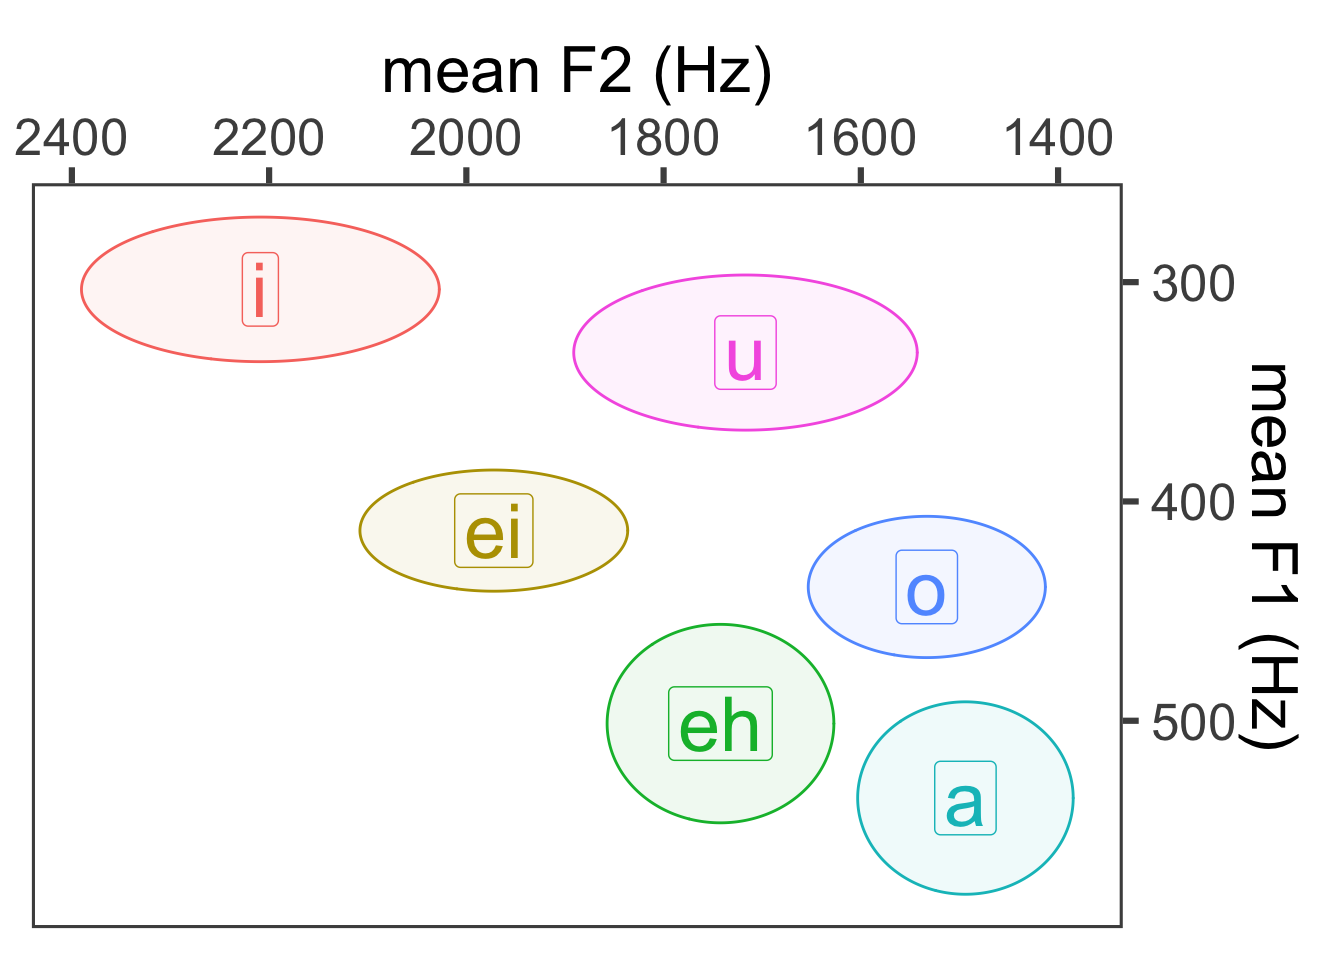
A slight layering difference:
ggplot(vowel_means, aes(x = meanF2, y = meanF1)) +
  #geom_point() +
  geom_ellipse(aes(x0 = meanF2, y0 = meanF1, a = sdF2, b = sdF1, angle = 0, color = Vowel, fill = Vowel), alpha = 0.07) +
  geom_label(aes(label = Vowel), size = 10) +
  theme_few(24) +
  scale_x_reverse(position = "top") +
  scale_y_reverse(position = "right") +
  xlab("mean F2 (Hz)") +
  ylab("mean F1 (Hz)") +
  guides(label = "none", color = "none", fill = "none")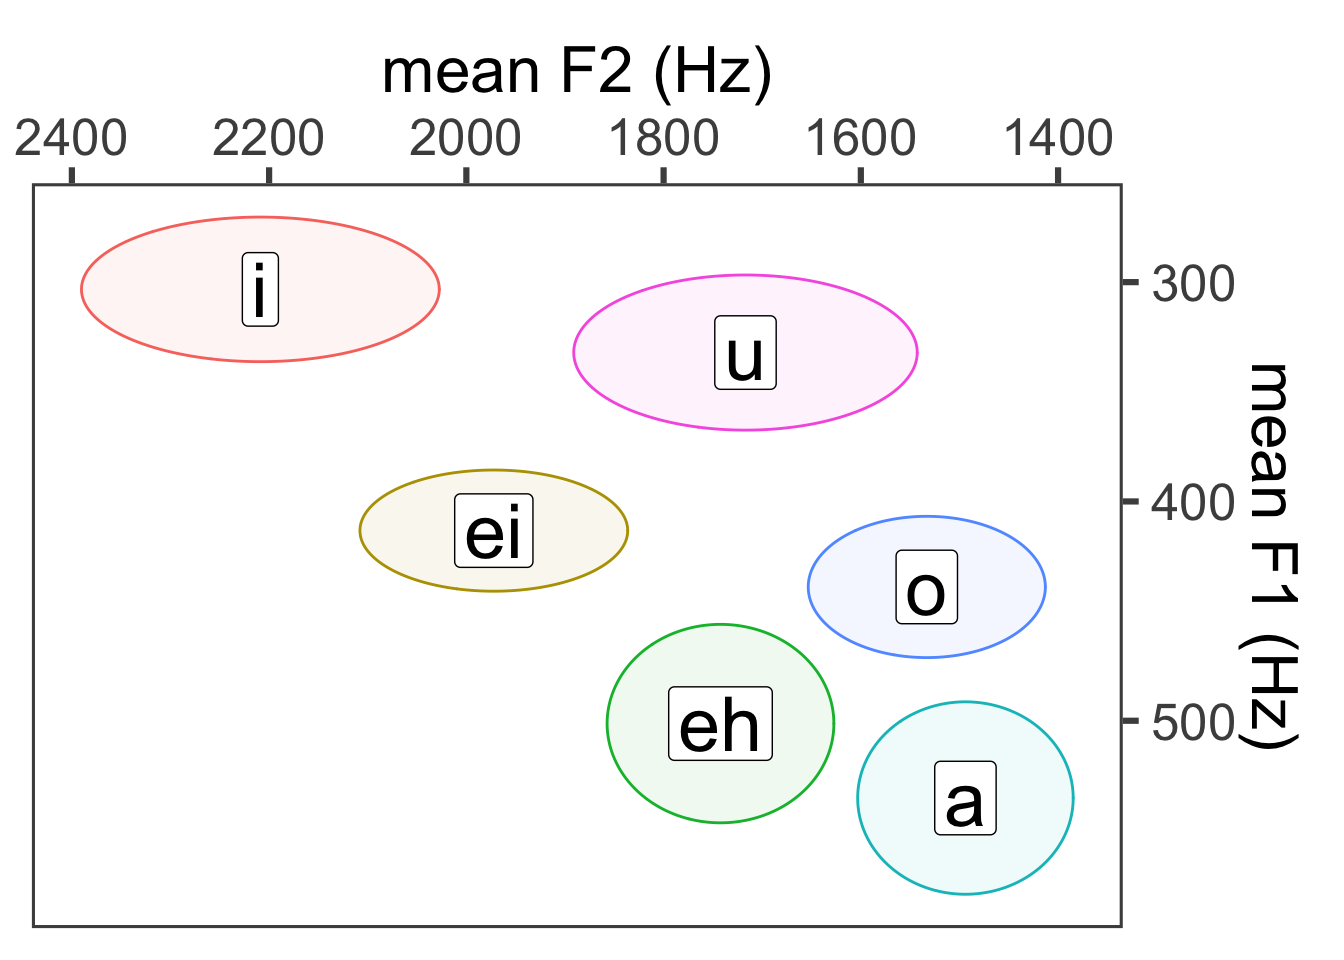
Using geom_text() instead of geom_label():
ggplot(vowel_means, aes(x = meanF2, y = meanF1)) +
  #geom_point() +
  geom_ellipse(aes(x0 = meanF2, y0 = meanF1, a = sdF2, b = sdF1, angle = 0, color = Vowel, fill = Vowel), alpha = 0.07) +
  geom_text(aes(label = Vowel), size = 10) +
  theme_few(24) +
  scale_x_reverse(position = "top") +
  scale_y_reverse(position = "right") +
  xlab("mean F2 (Hz)") +
  ylab("mean F1 (Hz)") +
  guides(label = "none", color = "none", fill = "none")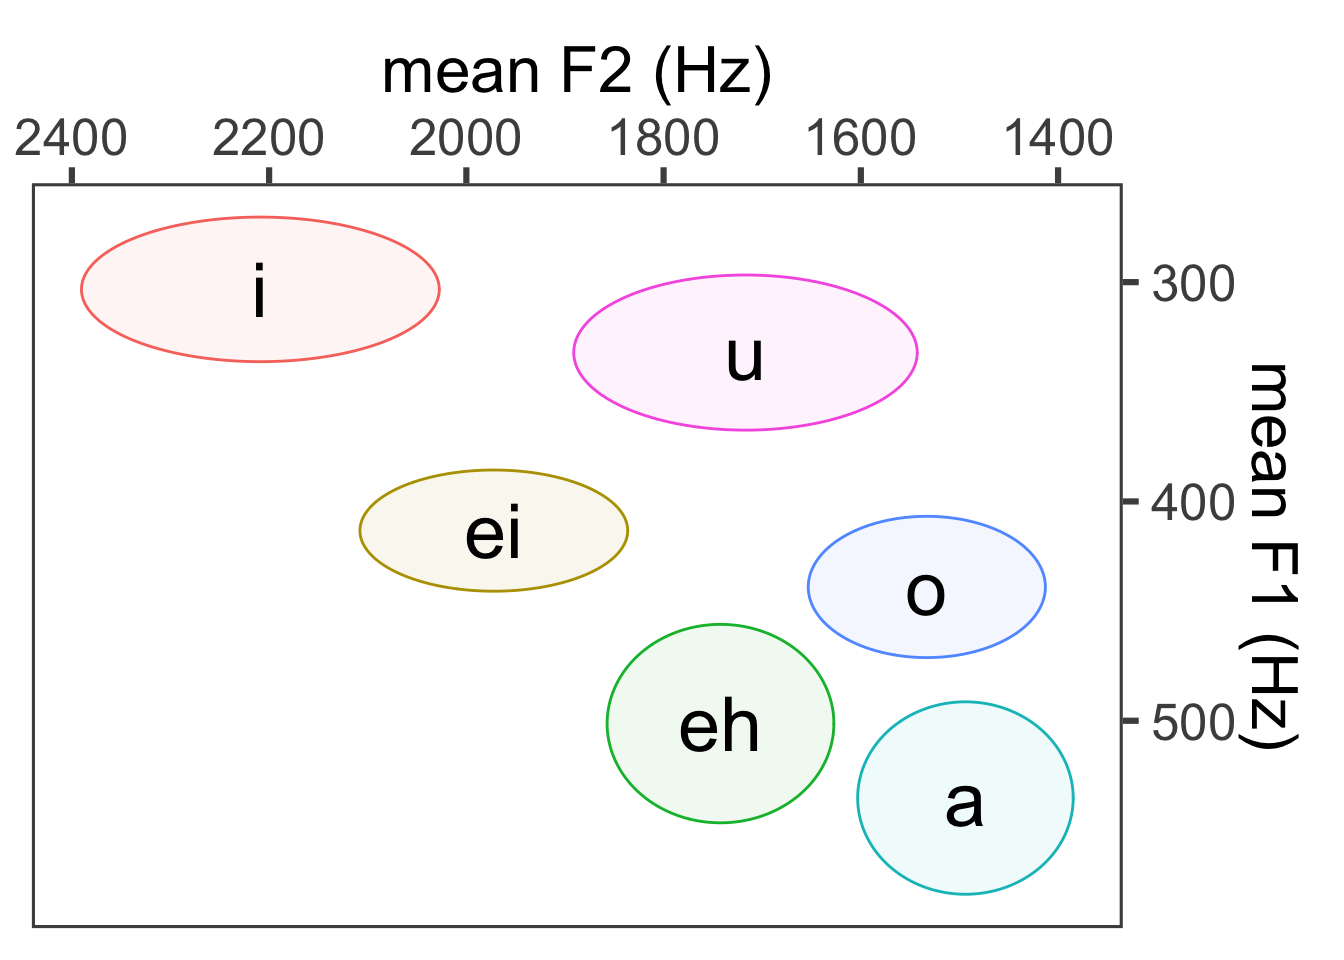
4.7 Saving images
You can save an image using various file formats. The simplest way to save an image is to click on the Export… button in the Plots panel. You should have the option save either as a PNG or as a PDF file there. One tip: increase the dimensions by a lot, otherwise the resolution will be crap. PNG is actually pretty hard to work with in my opinion. You’ll need to bump the numbers up to around 1000-2000 pixels, and then play around with the font size. For PDFs, the image should probably be around 7 to 12 inches. (This one only works in inches.)
The alternative option is to use the function ggsave(). ggsave() is a flexible and convenient function that can produce custom-resolution plots in png, pdf, jpeg, tiff, svg, eps, and more. (Look at the help page for more.) You can also specify dimensions in inches, centimeter, millimeters or pixels. As a default, ggsave() will save the last plot, or you can save the ggplot() output to a variable name and save that.
A few more notes: dpi refers to the plot resolution – for basic usage, I would recommend 200 dpi; for high resolution such as for publications, you should use 300 dpi. If you use Microsoft Word, make sure to always Save as PDF from the Print menu! This is a weird one, but if you just do Save as… and select PDF, it will reduce the resolution of all of your images. Choosing which file format to use for your image does come with various pros and cons – I’ve recently been using high-resolution PDFs a little more often than PNG as they will resize when zooming in and out of a document. That said, every once in awhile, Macs and Windows won’t play nicely with PDFs.
4.8 Practice
Create an R script to save the answers to these questions.
- Import ‘L2_English_Lexical_Decision_Data.csv’ into R and call it ‘lex’. This data set contains reaction times (RT) in milliseconds to words and nonwords of English from L2 English speaking participants. More info about the data and project here.
- Create a histogram of the reaction times (RT column). It will probably look weird because of the extreme range of RTs.
- Get a summary of the RT values, and take a look at the maximum value. Something can’t be right there.
- Create another histogram of the reaction times where the x-axis only includes values from 0 to 5000 ms.
- Based on the histogram, it looks like values above 2500 seem pretty improbable. Create a subset of lex which only retains reaction times below 2500 ms. Call this lex again.
- Create another histogram of reaction times using the new dataset and change the background theme, along with the outline color and fill of the bars.
- Let’s say we’re interested in comparing reaction times of L1 English speakers against L2 English speakers. Create a new column called ‘L2’ that indicates whether a speaker’s dominant language is English or not English. Specifically, if the domLang column is equal to English, the value in the L2 column should be “L1 English”, otherwise the value in the L2 column should be “L2 English”.
- Let’s also say we might want to look at any potential effects of gender. Create another column in lex called ‘gender’. If the sex of the participant is equal to 1, then the new value in the ‘gender’ column should be “m” for male, otherwise the new value should be “f”.
- Create a boxplot with the L2 status on the x-axis and the reaction time on the y-axis.
- Recreate the same boxplot in 8, but use the aesthetic mapping to map color to the gender column.
- Recreate the same boxplot in 9, but also change the background theme and provide more descriptive labels.
- Create a new column called ‘accuracy’. If the column ‘acc’ is equal to 1, then the value in ‘accuracy’ should be equal to “right”, otherwise the value should be equal to “wrong”.
- Create a bar graph with accuracy on the x-axis and the fill of the bar mapped to the L2 status. This should create what’s called a “stacked” bar graph, where the number of “right” answers for L1 English speakers is stacked on top of the number of “right” answers for L2 English speakers.
- To create a “dodged” bar graph where the bars are next to each other, you’ll need to use the following argument:
Give that a try.
Now take the same graph from 14 and change the background theme and colors.
Now we need to practice creating a scatterplot, but sadly there aren’t two good continuous variables in the lex dataset. We’ll instead use the mcm dataset. If you don’t have that loaded in to your R workspace, load that in now.
Make sure you have the column for ‘gender’. If you don’t have this column, you can recreate it using the following line of code:
- Create a scatterplot that allows us to visualize the relationship between F1 and F0. Put F1 on the x-axis and F0 on the y-axis.
- You might have noticed that F0 looks a little bimodal. This is likely due to gender differences. Create the same scatterplot in 18 but map color to gender.
- Now take the same scatterplot from 18 and facet by vowel category (Vowel).
- Reorder the vowel category so it shows up as: “i”, “ei”, “eh”, “a”, “o”, “u”.
- Now recreate the scatterplot from 20 and also change the background theme and add a little more detail to the axis labels (i.e., that these measures are in Hz).